
Control charts are one of the key tools of statistical process control (SPC), which allows monitoring the stability and capability of production processes. Thanks to them, it is possible to detect undesirable deviations early, which translates into reducing errors, reducing costs and increasing production efficiency. If you want to learn how to implement control charts in your process and avoid the most common mistakes, we invite you to read!

Control Charts – what are they?
Control Charts or Shewhart Charts are used to illustrate variation in a process against control limits.
They consist of a graph with a horizontal axis (time or sample dependent) and a vertical axis. It shows the units to be measured (dimensions, temperature, pressure etc.)
Control Charts can be used to measure both the process and the product characteristics.
In 2024, the 9th most frequent IATF 16949 Major Nonconformance was 9.1.1.1 Monitoring & Measurement of Manufacturing Process.
Control Limit
Control Limits are the maximum (UCL) and minimum (LCL) error from the nominal value which can allow for the process or product to be in control.
They can be derived from customer or internal specifications such as Technical Drawings as well as machinery manufacturer’s user guides.
Alarm Limits
Many Manufacturers show that they have Control Charts in the Gemba. Unfortunately, these are often just ordinary spreadsheets for collecting data. They do not show what are the limits a product or process can reach before intervention is required.
In some situations, intervention does not occur until the process is already out of control and non-conforming products are produced in large quantities. Those who understand the pains of the Cost of Poor Quality can already see how this can be prevented, and we propose applying Alarm Limits to your Control Charts.
Alarm Limit rule of thumb:
Example:
If we plot this on a Control Chart we see the following:

From the chart above we can see some values are beyond the lower Alarm Limit (-0.67 mm).
In this example what should we do next?
- Step 1 – Take 5 measurements of the same characteristic on the product or the process.
- Step 2 – Average the number of measurements.
- Step 3 – Use the average as the actual value suspect measurement.
- Step 4 – Correct the process toward the nominal value to remain in the control limits.
Control Charts and Measurement Systems Analysis
Control charts are an indispensable tool in monitoring process stability, but their effectiveness is closely linked to the quality of the measurement system. Measurement System Analysis (MSA) allows you to assess how reliable the data obtained is and whether it does not introduce errors leading to false signals on the control charts.
If the measurement system is characterized by high variability, it can generate false alarms. It can also mask real problems in the process. Therefore, before implementing control charts, it is necessary to perform MSA, with particular attention to the GR&R (gauge repeatability and reproducibility) analysis. This is done to ensure that the source of variability is real process fluctuations and not imprecise measurements.
In addition, there is another aspect here. The measurement system and devices used to measure the characteristics of the process or product must be calibrated. They must also have the appropriate resolution to be able to reduce the level of measurement uncertainty.
If you want to learn more about MSA, see our training on basic tools: MSA according to AIAG.
Control Charts and Process Capability
By running control charts and collecting data in the next step of working with the process, its capability can be determined. Process capability is defined as:
A statistical measure of the inherent process variability of a given feature.
In simpler terms: A process is capable when it is stable and centered (the average value x ̿ coincides with the target value). And its measurement results are within the specification limits.
The assessment of the process capability is based on qualitative indicators Cp, Cpk; Pp, Ppk; Cm, Cmk. They allow to identify whether the manufactured products fall within the accepted specification limits defined by the customer.
According to the principles of statistics, the values of these indicators are responsible for producing a certain number of rejects. Therefore, in the automotive industry, a value of >1.67 is assumed. It corresponds to the accuracy class of +/- 5 sigma. This is what will allow to produce 0.06 PPM. Therefore, conventionally, we can assume 0 PPM. However, such a value of process capability significantly increases its cost, which is why some OEMs require >1.33. With this accuracy class corresponding to +/- 4 sigma, 63 PPM will be created. Therefore, at an early stage of project management, it is necessary to recognize what the customer specific requirements are.
We will discuss process capability in another article. In the meantime, we invite you to our SPC according to AIAG.
The Rule of Seven
The most basic rule for interpreting a control chart is the “Seven Point Rule.” It is defined as:
A run of seven or more consecutive points in a Control Chart, either above the mean (or nominal), below the mean, or continuously increasing or decreasing, may indicate the process may be out of control.
What does this look like on a Control Chart?

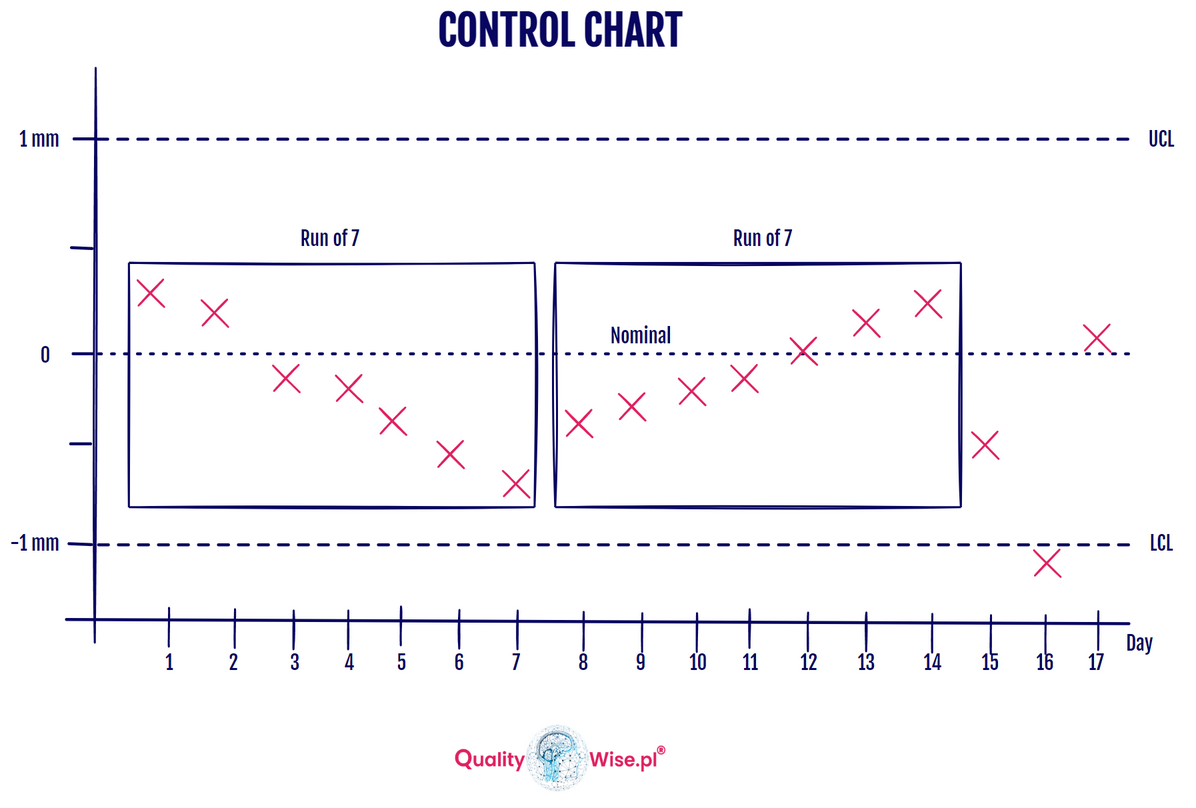
We can see from the Control Charts that the seven values are within the control limits and less than the Alarm Limits. But the idea of the Rule of Seven is to act before the process becomes out of control.
Tips for Control Charts
- Confirm your Measurement System is calibrated and within acceptable limits of variation (e.g. MSA Gage R&R<10%).
- Measure 30 random samples from the process to study the process variation. (Number of samples may depend on the customer.)
- Plot the values on a Control Chart.
- Assign Alarm Limits, we recommend using 66% of the Upper and Lower Control Limits (tolerances).
- Stop the process when it moves towards unacceptable limits; the rule of 7 or CP, CPK is breached.
- the process and measure parts to confirm is compliant.
Control Charts in IATF 16949:2016
It’s important to understand the link between Control Charts and IATF 16949.
Clause 9.1.1.1 Monitoring and measuring the manufacturing process
- Process studies shall be conducted for all new manufacturing processes (including assembly or sequencing) to:
- verify process capability,
- provide data for monitoring the process, including for special characteristics.
NOTE: For some manufacturing processes, it may not be possible to demonstrate compliance through a capability factor. However, alternative methods such as batch to specification compliance may be used.
- Maintain process capability or performance in accordance with customer requirements for the part approval process.(…)
- Activate a response plan for characteristics that are not statistically capable or are unstable. These response plans should include:
- immediate actions to mitigate the effects of failures,
- 100 percent inspection, if applicable.
9.1.1.2 Identify statistical tools
Ensure appropriate use of statistical tools.
Verify that appropriate statistical tools are included:
- as part of the advanced product quality planning process (or equivalent),
- in the product risk analysis (e.g., DFMEA) (if applicable),
- in the process risk analysis (e.g., PFMEA),
- in the control plan.
9.1.1.3 Application of statistical concepts
Statistical concepts such as:
- variability,
- control (stability),
- process capability,
- consequences of overshoot
must be understood and used by personnel involved in the collection, analysis, and management of statistical data.
The IATF does not specify a specific type of process measurement method or means of identifying process variation, but… Control charts are the most common industry-leading method for statistical process control! Otherwise, 100% control remains…
Most common mistakes in using control charts
Control charts are a powerful tool in quality management. However, their improper use can lead to incorrect decisions and inefficient process operation.
- Incorrect selection of the control chart – e.g. using cards for continuous data (X̄-R, X̄-S) for discrete data (e.g. p card, np), which leads to incorrect interpretation of results.
- Ignoring basic assumptions – not taking into account factors such as normality of distribution, independence of samples or appropriate sample size.
- Out-of-date control limits – basing on historical data that does not reflect current process conditions, which can lead to incorrect decisions.
- Excessive interference in the process – correcting the process for every signal outside the control limits without analysing the cause, which increases variability instead of reducing it.
- Misinterpretation of results – treating individual points outside the boundaries as evidence of non-compliance, without taking into account trends and rules for detecting process instability.
- Too infrequent or irregular use of cards – lack of consistency in process monitoring makes the tool lose its effectiveness.
- Lack of action after detection of warning signals – ignoring disturbing trends or taking unsystematic corrective actions.
- Lack of user training – people analysing control cards are often not properly trained, which leads to incorrect decisions and ineffective use of the tool.
Avoiding these errors allows for more effective process monitoring and better quality management in the organization.
Listen to our podcast!
Let’s sum up
Control cards are one of the most effective statistical tools supporting quality management. They allow for ongoing monitoring of process stability, identification of trends and response to emerging deviations before they turn into serious problems. Their proper use allows for reduction of variability, minimization of losses and optimization of process parameters. However, their correct implementation and interpretation are crucial. Only then can they effectively support decision-making and lead to continuous improvement of production processes. Therefore, quality specialists, process engineers and production team members need to be trained effectively to be able to control the process and intervene when issues arise.
We hope that with this article you will be able to understand the usefulness of Control Charts!
For people who want to know more:
MSA – Measurement Systems Analysis, 4th edition, 2010
SPC – Statistical Process Control, 2nd edition, AIAG, 2005
IATF 16949: 2016 Requirements for quality management systems in serial production and the production of spare parts in the automotive industry, 1st edition, 2016
All content on the qualitywise.pl website is a private interpretation of publicly available information. Any convergence of the described situations with people, organizations, companies is accidental. The content presented on the website qualitywise.pl does not represent the views of any companies or institutions.